
QS-WAN: the console you run the whole network from
QS-WAN is the control plane. One browser tab that holds every gateway, every enrolled device, every policy and the evidence that any of it happened. It is the piece about 1% of an organisation ever opens, and the reason the other 99% never need a dashboard at all.
Centralised control, and what that actually means
Every gateway shows as a live card with nine indicators: state, server, websocket, tunnel, heartbeat, assigned IP, update status, and current users, download and upload.
- State
- Server
- Websocket
- Tunnel
- Heartbeat
- Assigned IP
- Update status
- Current users
- Download and upload
Those separate on purpose.
The tunnel, the VPN server and the control channel can fail independently, and a product that shows you one green light for all three is hiding the failure you need to see.
One honest limit, said up front.
The database is authoritative; delivery out to gateways and clients is best effort. A green response tells you the intent was recorded. It does not tell you a laptop that’s been shut since Friday has already obeyed it. When the device comes back, it converges.
Managing a fleet of gateways
A gateway comes two ways, and the console treats them the same either way.
On-premise
Hardware at the site: your own, or a unit we ship you.
Virtual, in your cloud
The same gateway, running in your cloud instead of a rack.
Gateway Sync
Checks what a gateway is actually running against what you asked for, and pushes the difference.
Gateway settings
They show you the rendered configuration file, not a form that hides it. Overrides are visible.
When Tower Connection is off, changes save but don't get pushed.
The console says so. The intent is recorded and it converges when the gateway is reachable again.
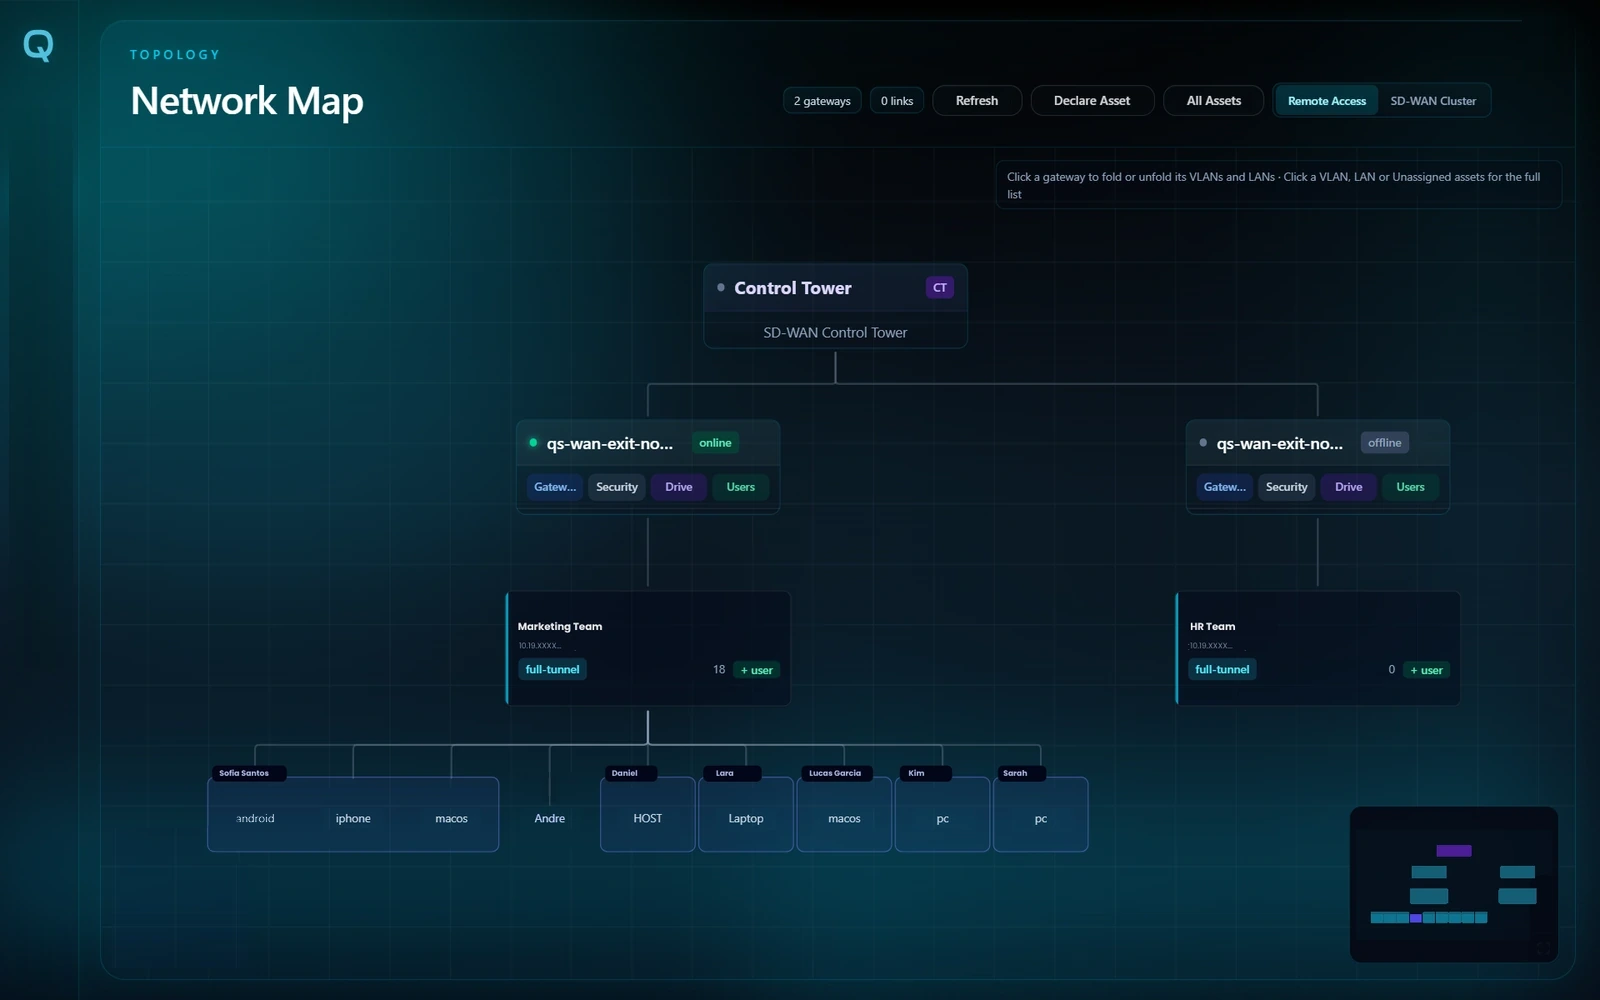
The Network Map
The network drawn as a picture: gateways, VLANs, the LANs next door, discovered hosts, and how traffic is allowed to move between them.
It's the fastest way to answer the question that usually takes three people and a spreadsheet, which is “can this device reach that server, and why”.
- Bidirectional
- Unidirectional
- Disabled
The Security Dashboard
Eight tabs, and the one people look at first is the risk score.
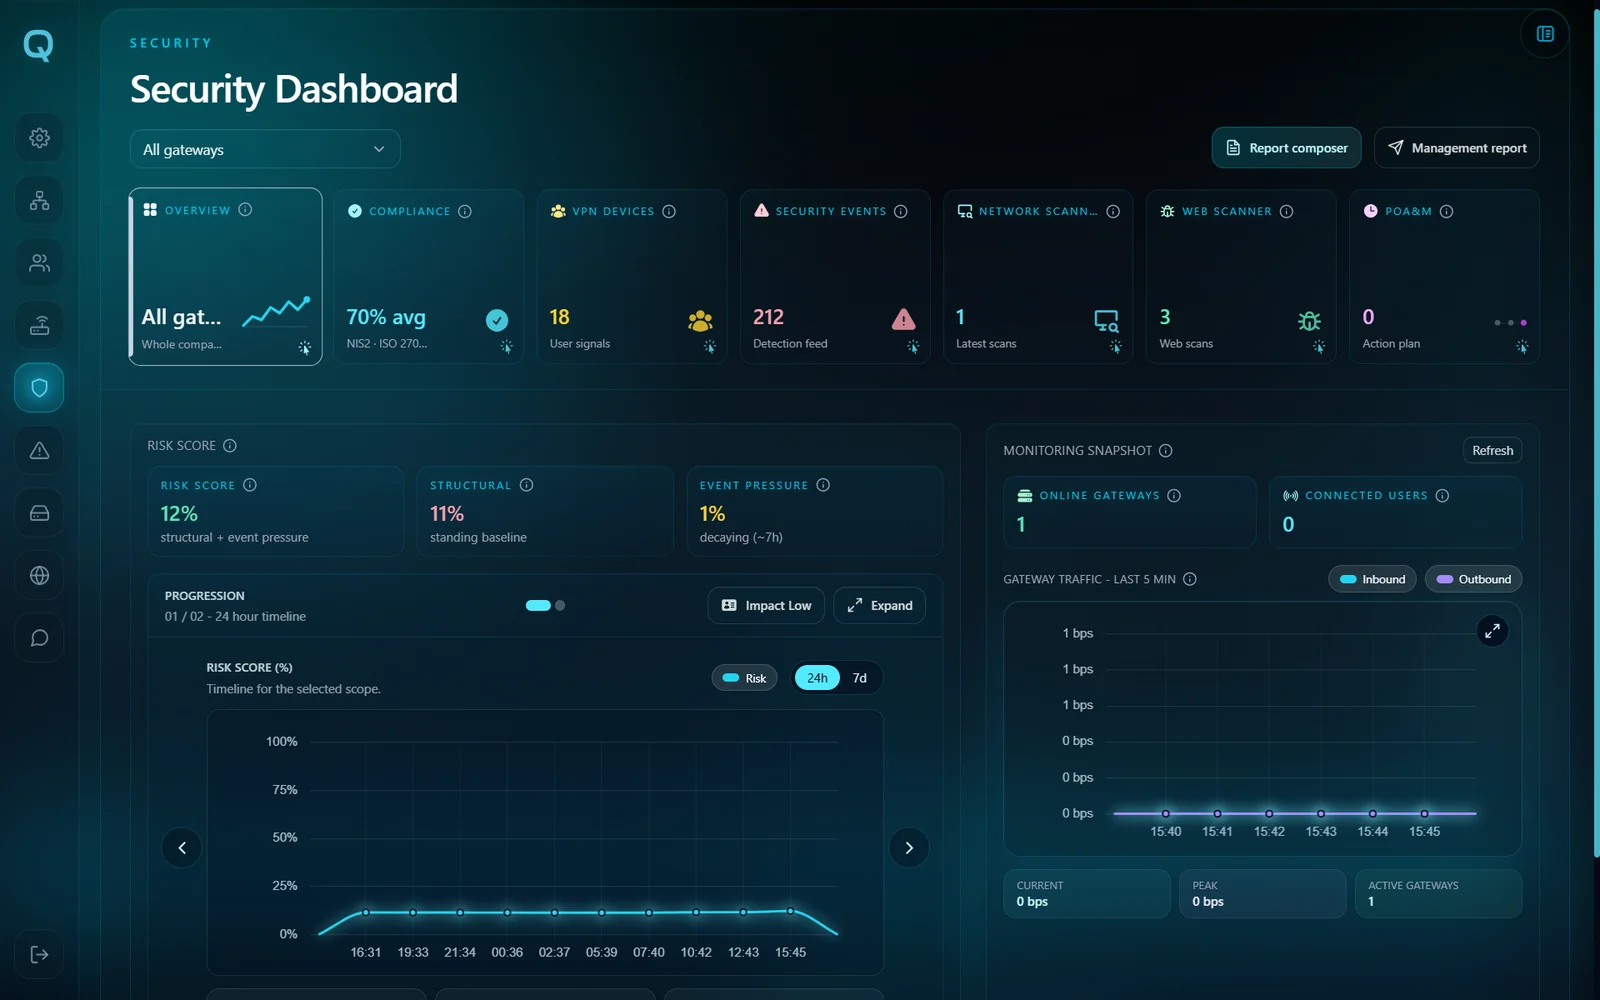
The score is built from 19 indicators and it explains itself line by line.
You can see which indicator moved it and by how much. A number you can’t take apart is a number nobody trusts twice.
Also in there: RMF assessments and the ATO lifecycle, a POA&M register, and a compliance crosswalk that maps one control to several frameworks at once so you stop answering the same question four times.
Run QS-WAN on your own infrastructure or in your private cloud and every gateway, device, policy, risk score and audit record stays in your installation. The accounts that can open it are the administrators you create, signing in locally or against your own directory.
Nobody at QuantumNova watches your network. The dashboard is yours, the score is yours, and the alerts land in your console, not on our desk.
Scanning, built into QS-WAN
Network Scanner
Runs nmap with presets, so you don’t have to remember flags.
Web Scanner
Scans your web applications and shows alerts, discovered URLs and technical detail.
Host Endpoint Monitoring
Part of QS-WAN, fed by telemetry from the agent on each machine.
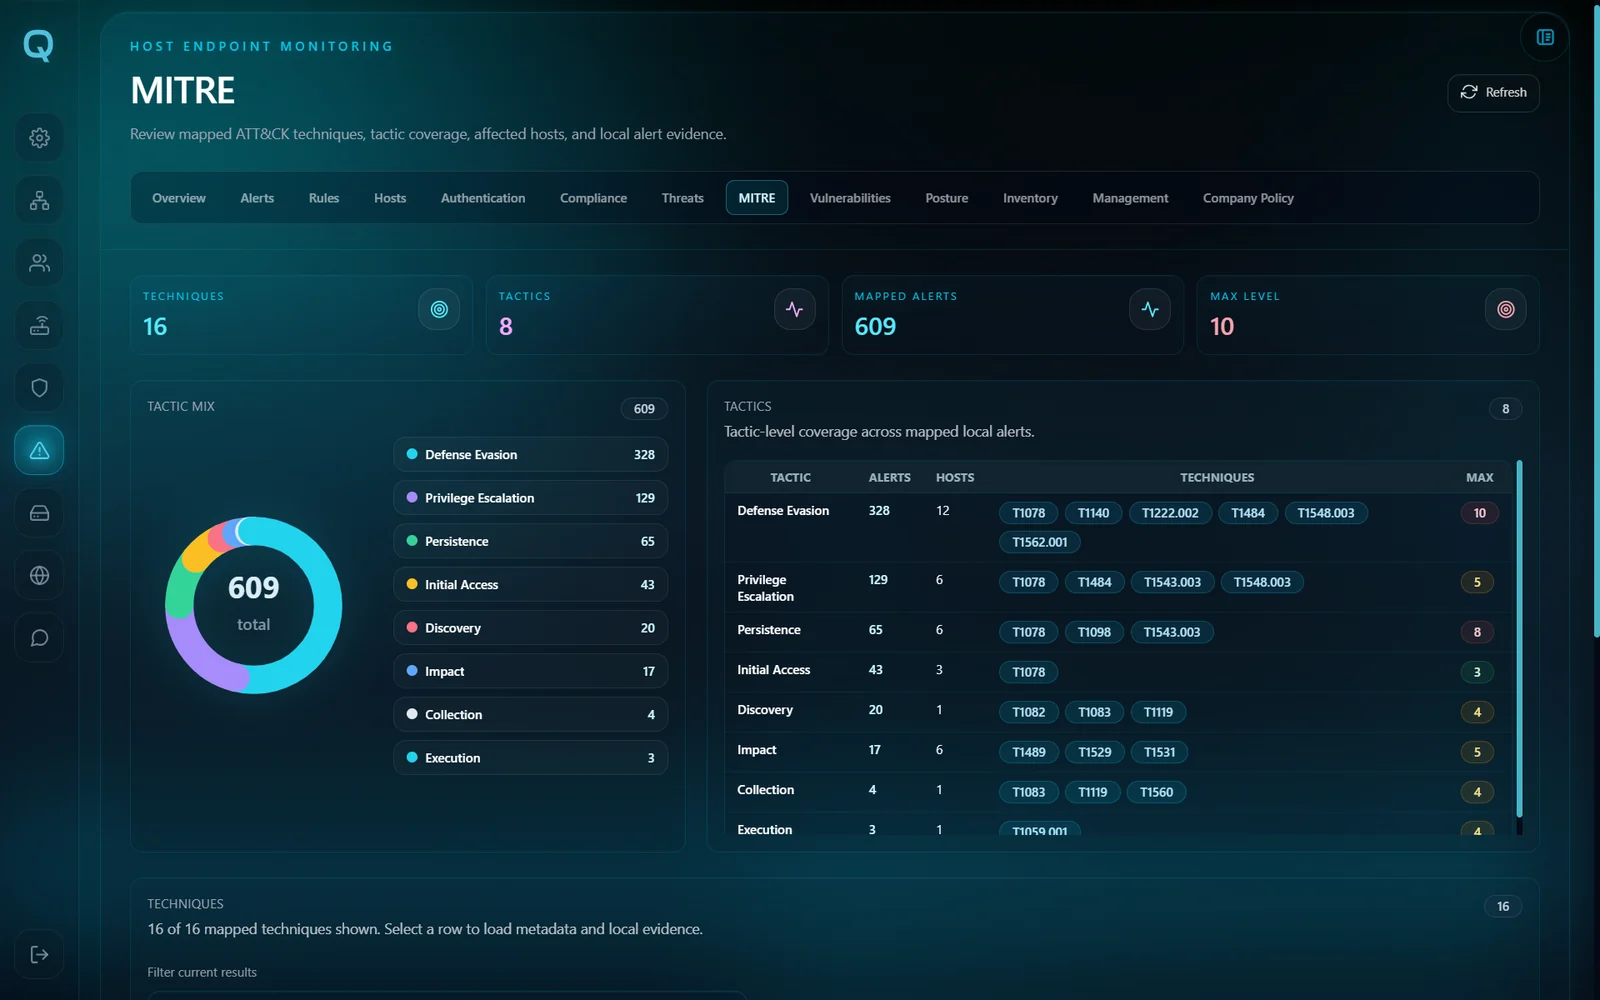
Host Endpoint Monitoring gives you
- Alerts
- Rules
- Hosts
- Authentication
- Configuration compliance
- Threats
- MITRE ATT&CK mapping
- Vulnerabilities
- Posture
- Inventory
- Active response
Events and the audit trail
Every security event lands in a feed you can filter, and every administrator action is written down.
When an auditor asks who changed the firewall rule and when, the answer is a query, not an archaeology project.
Company Policy
One signed policy, pushed to the fleet:
- VLANs
- DNS profiles
- Firewall rules per gateway and per user
- USB port control
- Country and IP allow lists
- Weekly schedules per VLAN
Reactive lockdown arms on 8 of the 12 rules.
Not all twelve. If a page tells you every rule triggers automatic revocation, that page is wrong.
WANDA, the governed assistant
WANDA is an assistant built into the console. The thing that makes it usable in a regulated environment is that it shows you exactly which fields it would send, before it sends them.
Languages, said precisely
The QS-WAN console ships in 15 languages. Two exceptions, and they matter if language is a formal requirement for you: the Security Dashboard and the 13 Host Endpoint Monitoring pages are English only.
Licensing and administrators
Platform licensing and registration live in the console, alongside per-device licensing, so the thing that generates the bill and the thing that shows the bill are the same screen.
See it on your own network
A demo runs about 30 minutes and we point it at your setup, not a sandbox we prepared earlier.